Understanding restaurant categories
These are fast-changing times for all types of restaurants. Brands that stand out can use big data to spot trends, measure performance, and create strategies that will drive profits. That’s who we serve at Black Box Intelligence. We compile comprehensive data on industry trends across all restaurant categories.
For our clients, we offer granular data on financials, consumers, customers, and workforce, as well as competitive intelligence that they use to benchmark against the competition. Here’s how to navigate the data we offer.
Broadly, the restaurant industry is divided into two umbrella categories based on the type of service provided.
Limited-service restaurants
At limited-service restaurants, customers order their food at a counter or drive-thru and pay before eating it. Quick-service and fast-casual restaurants fall under the limited-service umbrella.
Full-service restaurants
At full-service establishments, customers typically order their food at a table or counter, are served by waitstaff, and pay after consuming their meal. Fine dining, upscale, casual family dining, and casual dining restaurants fall under this category.
Restaurant industry trends we’re watching (by restaurant type)
Because BBI aggregates a large amount of data, we’re able to track the same metrics across both industry segments: financials, workforce intelligence, guest sentiment, and consumer intelligence.
One major trend we’re watching is the persistence of labor challenges. Our data shows that hourly turnover is up at both limited- and full-service restaurants, and it’s having an effect on business. The labor shortage is a key driver of dwindling guest sentiment in both restaurant categories. Many are pointing out frustrations with cleanliness and wait times, both of which are indicators of teams being stretched thin. Reducing turnover has become mission-critical for most operators.
Another trend we’re watching is pricing. Many restaurants are raising prices to deal with higher expenses, and it’s changing the way guests perceive value. In our examination of restaurant reviews from popular dating sites, we see fewer mentions of “good” and “reasonable” prices when compared to 2019. In full-service restaurants, guests are less likely to make positive comments about lunch and drink specials, or happy hour. In limited-service restaurants, terms like “not worth,” “extra charges” and “smaller portions” appear more frequently.
Beyond these broad restaurant categories, we also look at data from various types of restaurant segments.
Data by type of restaurant
Beyond these broad restaurant categories, we also look at data from various types of restaurant segments.
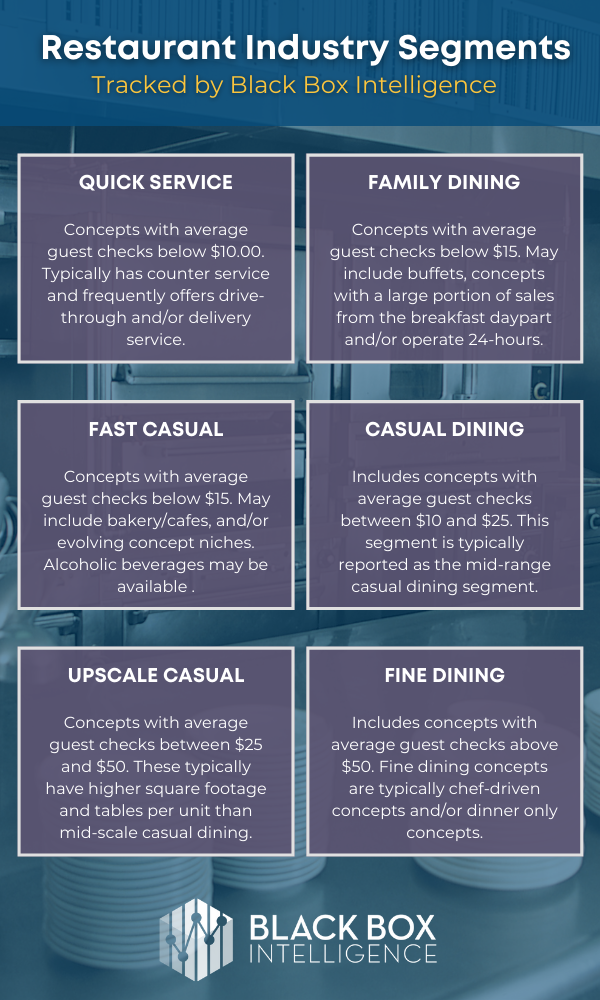
Quick service restaurants (QSR)
We define QSRs as concepts with average guest checks below $10.00. They typically offer counter service, and drive-through and/or delivery services are common as well.
Family dining restaurants
Family dining restaurants have average guest checks below $15. The food offering may include buffets, 24-hour operators, or concepts with a large portion of sales from the breakfast daypart.
Fast casual restaurants
The average guest check for fast casual restaurants is below $15. This category includes bakery/cafes, and concepts that offer limited service and/or evolving concept niches. They may also offer alcoholic beverages, but they’re typically a small contribution to the overall sales mix.
Casual dining restaurants
We define casual dining as restaurants that have average guest checks between $10 and $25. This segment is typically reported as the mid-range casual dining segment.
Upscale casual restaurants
Upscale casual restaurants include concepts with average guest checks between $25 and $50. Upscale casual concepts typically have higher square footage and number of tables per unit than midscale casual dining.
Fine dining
The fine dining segment includes restaurants with average guest checks above $50. These are typically chef-driven concepts and/or dinner-only concepts.
Major trends in these restaurant segments
From fine dining to fast casual, we track data from all types of restaurants and take a closer look at trends that deserve more scrutiny. For example, QSRs have seen a major surge in business due to the pandemic, and are continuing to perform well. As consumer demand for convenience spiked, QSRs were best positioned to respond with digital interactions and menus that worked well for takeout and delivery. Fine dining restaurants, which took a major hit due to government shutdowns, are finally making strides in improving sales.
Workforce data: tracking trends for FOH and BOH staff
At BBI, workforce intelligence is broken out by role. Front-of-house (FOH) workers are customer-facing, such as restaurant servers, bartenders, and hosts. Back-of-house (BOH) encompasses all of the employees who work in the kitchen, such as restaurant cooks, chefs, etc.
We measure turnover and pay for all restaurant categories and each type of employee. That enables us to measure, for example, what the data says about BOH employees in limited-service restaurants. Or we can look more granularly at BOH staff in fine dining restaurants specifically.
Restaurant data by payment type
We also track workforce data based on how employees are paid. Salaried employees are paid a set amount per year, and often receive a more comprehensive benefits package, including medical coverage and retirement. In contrast, hourly employees receive pay based on hours worked and, depending on the role, they may also earn tips. Benefits are often limited for hourly workers.
Because of the difference in compensation, the metrics tend to vary widely between the two categories. Salaried employees (such as restaurant managers and chefs) also tend to be those with longer careers in food service, whereas hourly employees may encompass students and workers looking for short-term work.
Restaurant staff trends we’re watching
One workforce trend we’re watching right now is that full-service restaurants are operating with 6.2 fewer BOH and 2.8 fewer FOH employees. As a result, they aren’t able to maintain full capacity. This is creating a difficult balancing act for operators who need to reduce costs and generate enough revenue to turn a profit.
Another trend we’re seeing is that 100% of restaurants are reporting shortages in hourly employees, and many are offering spot bonuses to improve retention. Many hourly employees are leaving the restaurant industry for higher pay, better work hours, more consistent income, and growth opportunities. For deeper insights into how the workforce has changed in the wake of COVID-19, read The Post-Pandemic Restaurant Employee: Who Wants to Work and Why.
How we track restaurant customer satisfaction
In addition to financial performance and workforce data, we also track guest sentiment. We collect insights from restaurant reviews on social media and rating sites and use algorithms to monitor trends and common themes. BBI’s guest sentiment data is segmented into six different topics, which we also often break out by restaurant category:
- Food
- Beverage
- Service
- Ambiance
- Value
- Intent to return
Food and beverage satisfaction trends
The food is the main event, so tracking what guests are saying about it is a no-brainer. We monitor what guests are saying about the quality of the food and drinks separately.
Currently, we’re seeing lower guest sentiment around food in both limited and full-service categories. Off-premise is a key factor driving it down. This is likely because it’s harder to control food quality when it’s being taken off-premise, and some menu items may not travel well. Beverage sentiment is down significantly, with many guests saying that orders are incorrect, poorly made, or taking too long. Staffing shortages likely affect these issues.
Restaurant ambiance trends
Ambiance is key to differentiating the customer experience. Depending on the restaurant category, ambiance may factor more heavily in how you view performance. For instance, ambiance is much more important at a fine dining restaurant than at a burger joint that prioritizes speed over the decor, comfort, and service levels.
Right now, ambiance is down significantly across restaurant market segments, likely due to short staffing and concerns about cleanliness. In reviews, many guests highlighted restrooms and tables specifically as areas of concern.
Restaurant customer service insights
Alongside ambiance, guest sentiment on service is down in both full- and limited-service restaurants, with full-service suffering significantly. Guests are frustrated with long wait times and understaffing. These frustrations, when combined with higher prices, are impacting guest perceptions of value. The value sentiment is quickly dropping as the average check value rises.
The data shows that guests may be nearing a breaking point, but they haven’t reached it yet. While intent-to-return sentiment is trending down, it’s still performing relatively well compared to other guest sentiment categories. Operators need to seize opportunities to respond to changing guest sentiment. Keep up with broader industry trends with the Restaurant Guest Satisfaction Snapshot, which offers regular insights into customer satisfaction.
Better restaurant insights translate to better performance
BBI balances industry-wide insights with detailed, real-time data for our clients. Because of the breadth of our dataset, all of the data we collect is tracked across restaurant categories so we can compare performance throughout the industry.
We provide our clients with the ability to drill down into industry data based on the segments and attributes that matter most to them. To see how it works, schedule a demo.